I've been working on a project that uses Coralogix for observability. The project is a NextJS app deployed on Vercel that talks to serverless apis running as AWS Lambdas. I wanted to share some of the things I learned along the way and hopefully help someone else out with all the things I had to figure out (so far).
note: I happen to use Coralogix, but this should work with any observability platform that supports OpenTelemetry.
§First, The Architecture
The first thing we need to do is get you up to speed on the architecture of the project.
- NextJS App(s): This is the front-end of the project. It's a collection of NextJS apps wrapped in a monorepo managed by Turborepo (https://turbo.build/) and are using the new App Router setup.
- Vercel: This is where the NextJS apps are deployed. Vercel (https://vercel.com/) is a great platform for deploying NextJS apps and I am in absolute love with it.
- Serverless APIs: These are the back-end of the project. They are a collection of AWS Lambdas that are deployed using the Serverless Framework (https://www.serverless.com/).
- Mongo Atlas: This is where the data is stored. It's a managed MongoDB service (https://www.mongodb.com/products/platform/atlas-database).
- Coralogix: This is the observability platform we are using. It's a great platform that supports OpenTelemetry, Logs, Anomaly detection, and so much more (https://coralogix.com/). I'm a massive fan and highly recommend it!
All these pieces fit together like this:
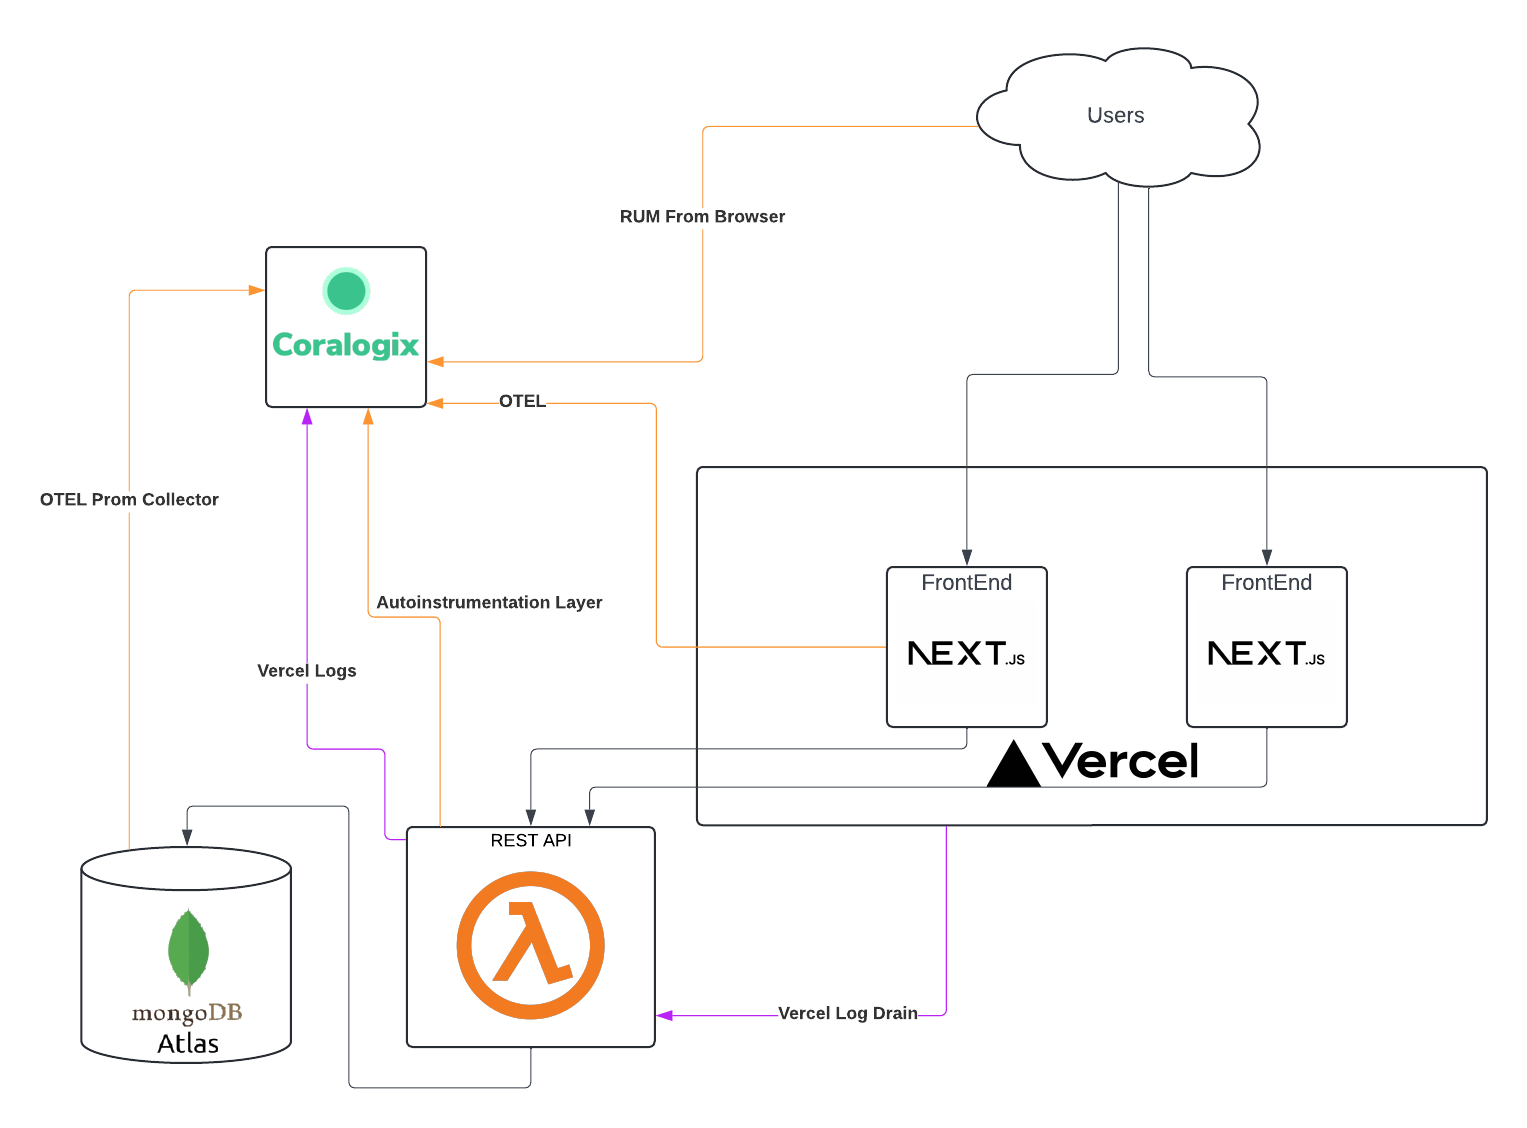
We are using Coralogix Real User Monitoring (RUM) to track user interactions with the frontends which is executed from the client's browser and reports back to Coralogix.
We have configured the Vercel Otel collectors and added the Vercel Otel library to the apps. This sends trace data to Coralogix.
The Vercel logs are sent to Coralogix by using Log Drains that send to a lambda function that transforms the logs from Vercel to Coralogix and pushes to the Coralogix API.
Lastly, we are using the Coralogix Lambda Layer to send trace and log data to Coralogix from our 100s of functions.
Ok, now that you know the architecture, let's get into the details.
§The Problem
The NextJS app router kind of flips a Javascript app on its head. Because NextJS supports Server-side Rendering (SSR) you can do things like fetch data before the page rendering and serving phase and that data is available to the page when it renders. This is great for performance, caching, and even gets around things like CORS issues, but it also means that the page is rendered on the server and then sent to the client. This means that the client-side code is not executed until the page is loaded on the client and we need to collect trace data from the SSR parts. This is the core of our issue. It wasn't super clear on how to get the trace data from the server-side code to Coralogix.
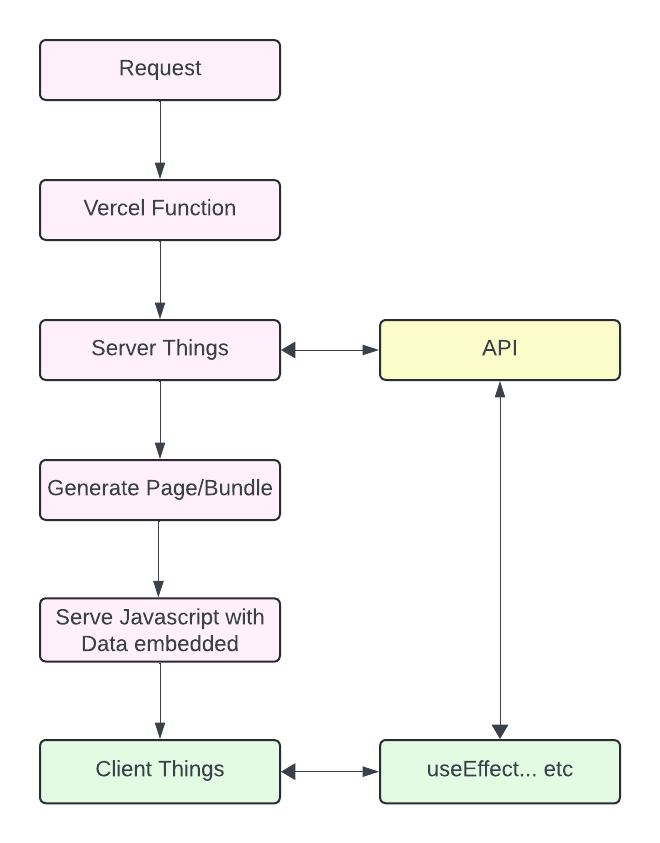
(All the pink boxes are on Vercel servers and the green is executed on the client's browser)
We had trace spans from all the lambda functions but the root span started at the API call.
We had trace data from RUM but it was only for the client-side code and had it's own root span.
Stringing it together was a challenge in Coralogix. Plus we're missing a bunch of timing data from inside Vercel's serverside functions on their platform.
§The Solution
Vercel supports Opentelemtry but there's a little setup which is documented here: https://vercel.com/docs/observability/otel-overview
Despite being the "quick start" its still not clear on how to get the data out of Vercel and their in-built observability tools.
I found that Checkly demystified much of the process here: https://www.checklyhq.com/docs/traces-open-telemetry/instrumenting-code/nextjs/
I encourage you to read their docs and understand what's going on, however, it doesn't explain the secret sauce to get it to communicate with Coralogix. So I'll summarize everything and show you what needs to be set and where.
§Install the Packages
First you need to install the required packages:
npm install --save \
  @vercel/otel \
  @opentelemetry/api \
  @opentelemetry/sdk-trace-base \
@opentelemetry/exporter-trace-otlp-http§Enable Telemetry
Next you need to enable the telemetry in NextJS by adding the hook to your Next config file:
(usually found in the root of your project as next.config.js)
const nextConfig = {
  experimental: {
    instrumentationHook: true
  },
  ...
  ...
}

module.exports = nextConfig§Setup Opentelemetry for the App
In the root of your app directory you need to create an instrumentation.ts (or instrumentation.js if you don't use typescript)
// instrumentation.ts
import { registerOTel } from "@vercel/otel";

export function register() {
  registerOTel({
    serviceName: "my service name",
    instrumentationConfig: {
      fetch: {
        propagateContextUrls: [/.*myapi.com/],
      },
    },
  });
}
I want to explain a few things in this configuration.
The first part is straight forward, setting your service name and registering the Otel instrumentation is straight out of the example docs.
The additional configuration under fetch configures the fetch library instrumentation. The propagateContextUrls is a setting that tells fetch to propogate the tracer to the included urls. In my case this is Super Important because the lambda functions are on a different host than the application. So without that configuration, traces aren't connected from Vercel to Lambdas because the traceparent headers aren't sent properly.
§Configure Otel on Vercel
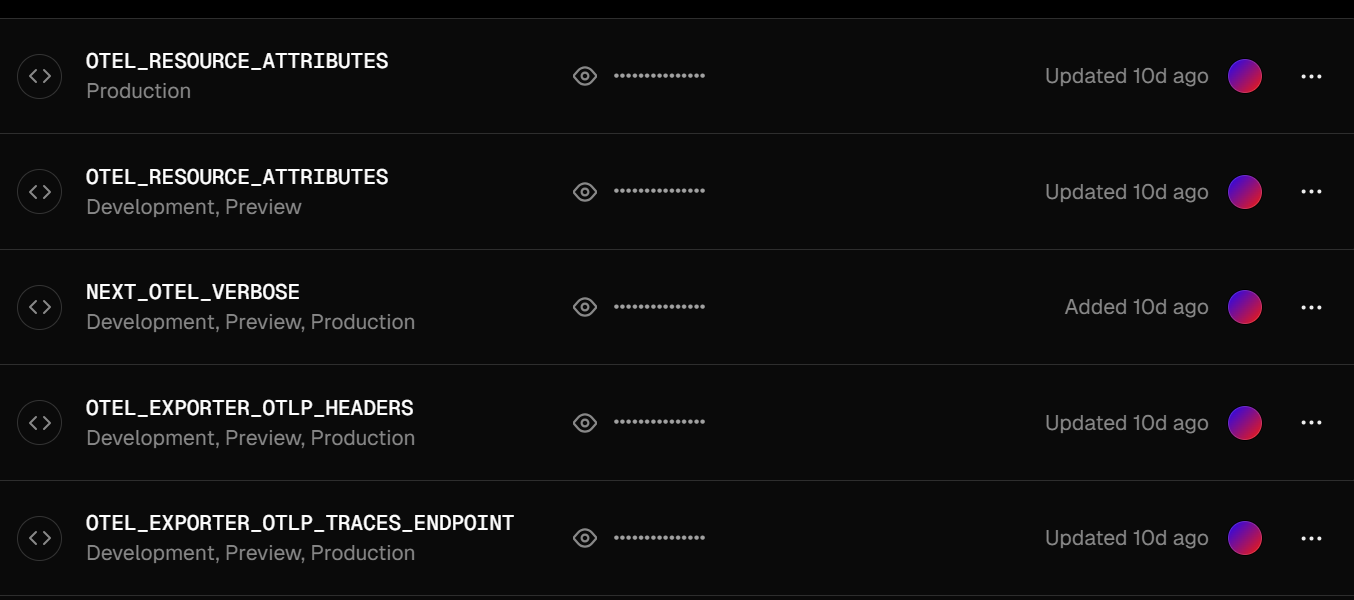
There are 3 key configuration variables and one optional one.
- OTEL_RESOURCE_ATTRIBUTES
- OTEL_EXPORTER_OTLP_HEADERS
- OTEL_EXPORTER_OTLP_TRACES_ENDPOINT
- NEXT_OTEL_VERBOSE (optional)
If you are testing locally you set these environment variables like this:
export OTEL_RESOURCE_ATTRIBUTES=cx.application.name=my-cora-app, \
                                cx.subsystem.name=vercel, \
                                service.namespace=my-cora-account-name
export OTEL_EXPORTER_OTLP_HEADERS=Authorization=Bearer $my-cora-apikey
export OTEL_EXPORTER_OTLP_TRACES_ENDPOINT=https://ingress.coralogix.us:443/v1/traces
export NEXT_OTEL_VERBOSE=1
Let me explain these if it's not obvious:
cx.application.name and cx.subsystem.name are required but are what ever you want to set
service.namespace is a little confusing until you know what it is. Its your Coralogix account name.
So if you login to https://my-awesome-app.app.coralogix.us then your namespace is my-awesome-app. This is required so that their collector knows where the data is supposed to go. This tripped be up for hours on a Sunday.
Next we have OTEL_EXPORTER_OTLP_HEADERS which are headers sent to the endpoint. You must set the Authorization header and you set the value as Bearer <CXToken> where the <CXToken> is an api key for you account.
Next we have the endpoint. This seems straight forward but Coralogix's documentation is a little confusing here. You can find the endpoints in the docs here: https://coralogix.com/docs/coralogix-endpoints/ and you can see under Opentelemetry is says for a US account it is ingress.coralogix.us:443 This is true if you're using GRPC, but the GRPC stuff in vercel had tons of strange issues when I was working on this so I set it to use http by not setting the GRPC environment variable.
So because we are not using the GRPC endpoint we need to add /v1/traces and the https:// as shown in the example.
Lastly we the optional NEXT_OTEL_VERBOSE=1. This adds internal APM spans at a small cost to the server side rendering. We like having the extra data, so we turn that on.
Ok, so know you've set the settings, so if you run yarn dev it should start sending to Coralogix!!! AWESOME!
But now I want to set this up to do this from Vercel!
§Configuring Vercel
This is super simple, all you need to do is go to your app's environment variables in the settings tab and set those environment variables. Once you've done
No just redeploy your app and BOOM! Traces! And Traces from the start of the request all the way to the database!
§Things that still don't work
So this gets me 90% of the way there, but there is certainly room for improvement (which will likely be a follow up post)
§RUM doesn't work as expected
As I said earlier, we use Coralogix RUM and NextJS actually does a bunch of stuff on the server before it even sends the first bit to the client.
This means we have created a trace parent before RUM even exists. As of writing this, I have not figured out a way to get the Traceparent/context to the loaded RUM on the client's machine. It's a chicken and egg problem. I know that RUM will add spans to a tracer that it got in the request headers because Checkly does this and it works great! But I can't see a way to get the context in the page.tsx (server side rendered part) to pass to RUM object before it's sent to the client. There's quite a bit more research to be done here and maybe the folks from Coralogix can set me straight.
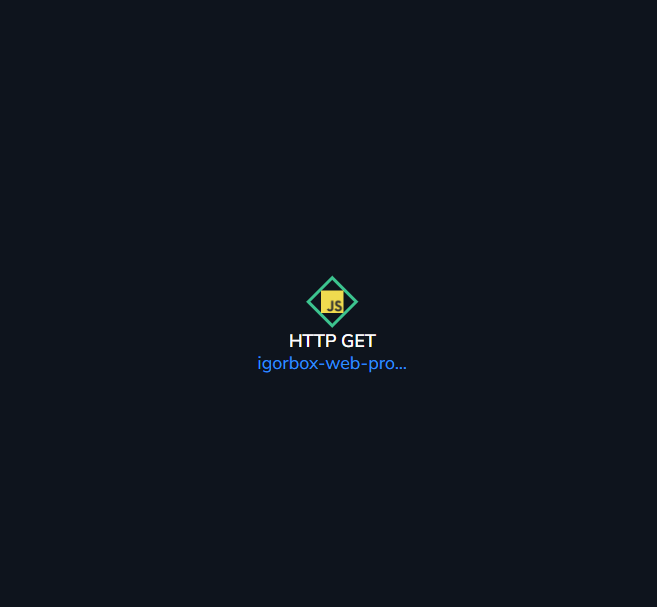
But for now all of my RUM based spans look like this (sad panda):
§Database Info
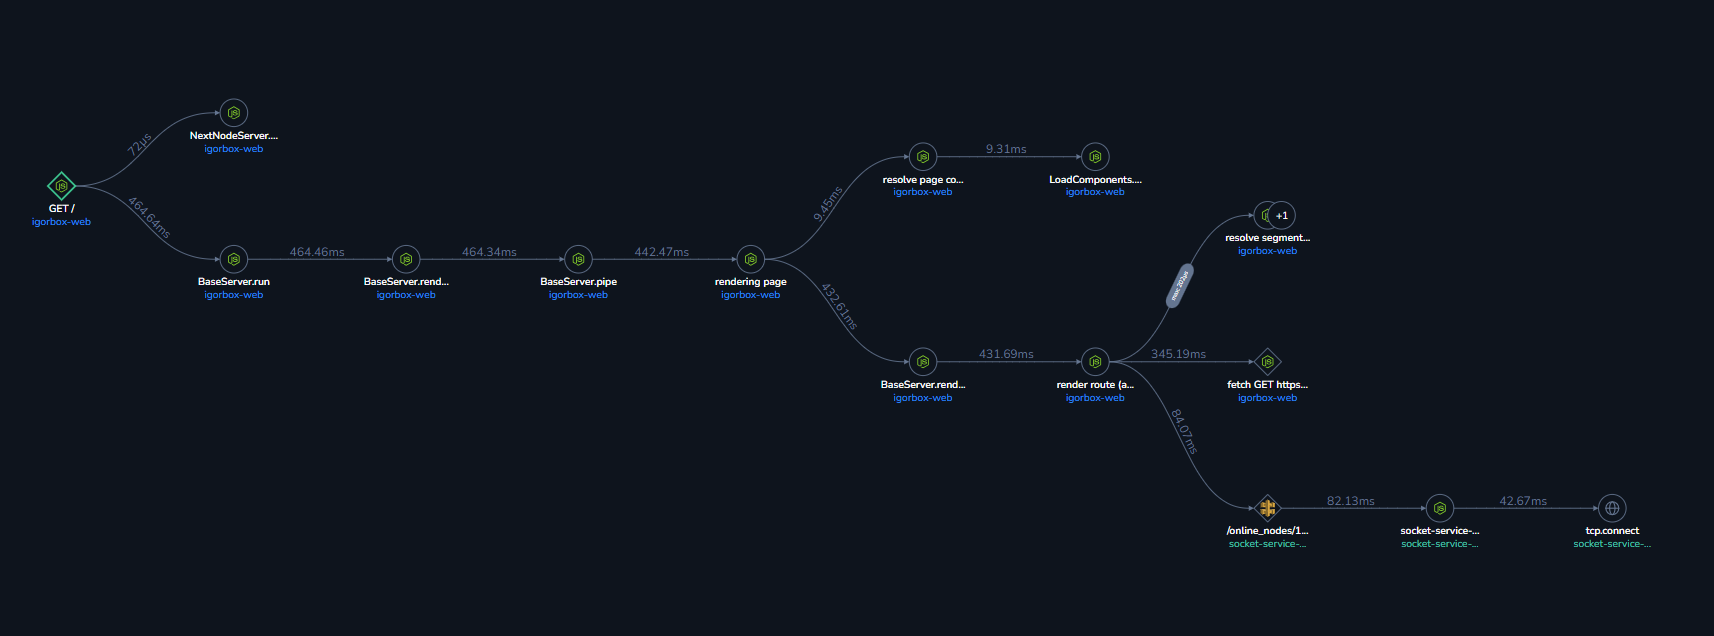
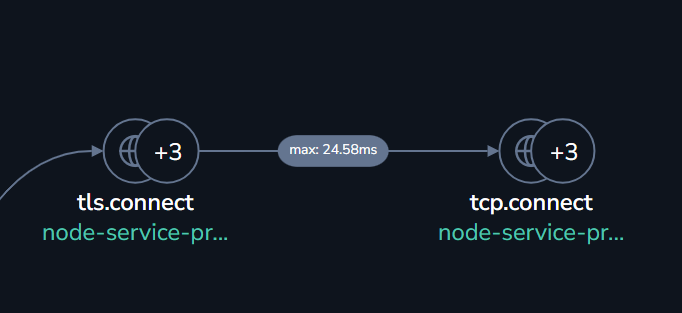
Up until a few months ago, my trace data from my lambda functions included database info from Mongo Atlas. It was kind of neat, but something changed and now it only shows a request was made to the function but doesn't detect it's mongo or collect database info on my lambda functions.
I'm using the autoinstrumentation lambda layer provided by Coralogix and I think its been broken since version 10-ish? Hopefully that gets fixed. I don't do anything fancy with Mongodb in my lambda functions. Its the bog standard example stuff. Create a mongo client and use it in the function.
So all of my calls to Mongo Atlas now are just "TCP.connect"
§Native Coralogix Log Support
Today you can send logs from Vercel to Datadog by installing the plugin on vercel. There is no such thing for Coralogix. So I had to make a lambda function that accepts the Vercel log drains and transforms the logs into Coralogix logs to forward to their API. This was fine when Log Drains was in "beta" and it didn't cost anything, but now that its gone GA, I have to pay for Vercel Log Drains on my apps, then I have to pay for the lambda that is handling each log even (there are lots of logs), and then I have to pay for Coralogix to process it again! (also don't forget AWS network transfers.. etc)
I'm not saying I don't want to pay for logs to go from Vercel to Coralogix, but I'm kind of paying a tax (in the form of my AWS account in the middle) on the extra steps. It would be a dream if Coralogix and Vercel got together and just made a direct plugin.
For now, I'll just have to eat the cost of these transform lambda functions. (I may publish the code in the near future for others that want to do something similar)
§Conclusion
In conclusion, it took a bit of googling, stringing documentation together, and a lot of experimentation to get this to work. But even though I spent an entire Sunday on this, I am happy I did. It's so nice to have all this data for these applications and I'm sure over time things will improve. Maybe a follow up post will happen when I figure out how to solve some of the last mile short falls mentioned here.